
|
"Sociogram" is freeware. You can use "Sociogram" for free and it may be freely distributed, provided that the program is not altered in any way. However, you may not sell "Sociogram" nor include it in a commercial product (such as software CDs) without my permission. I have extensively tested the program but of course, I can not be held responsible for any damage or loss of data on your system from using "Sociogram".
Lewejohann, L. (2005): Sociogram (Version 1.0). [Computer software]. http://www.phenotyping.com/software/sociogram.html Scholarly reference to this program should be like: |
 |
|
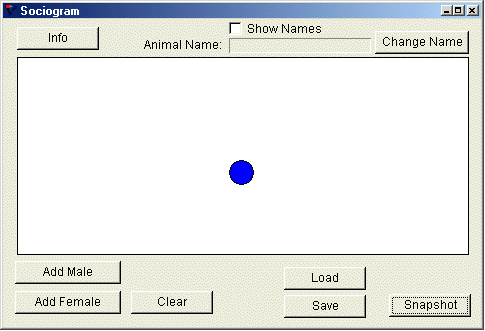
| Download version 1.0 for Windows here (952 KB). Download version 1.0 for MacOS X here (1340 KB). "Sociogram" is a simple program to generate sociogram-graphics showing the relationships between individuals (humans or animals). Let's start the tutorial by clicking on the "Add male"-button and thereby adding a blue circle representing a male individual. The circle can be moved within the white background with the mouse. |
 |
| By clicking the checkbox "Show names", the name of the individual "M1" is shown. In order to re-name it, double-click on the circle and | 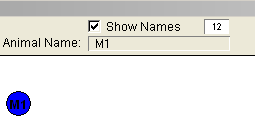 |
| press the button "Change Name". | 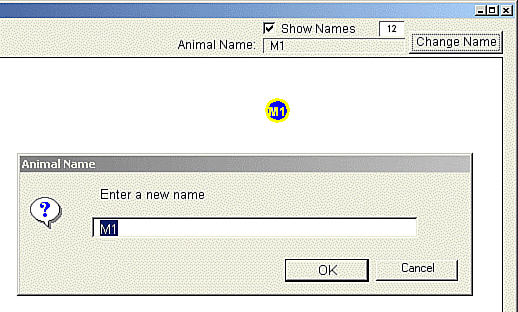 |
| Now we can create a female individual (red circle) by pressing the "Add Female"-button. Double-click on the circle in order to re-name the individual. To connect circles with lines, double-click on the first circle and then | 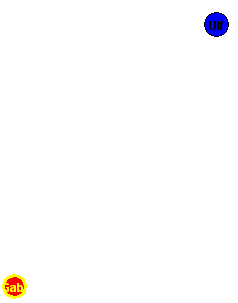 |
| double-click on the second circle. | 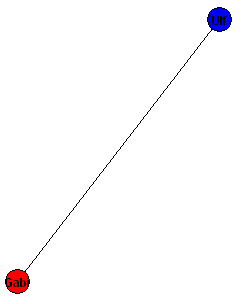 |
| By single-clicking on the line (an accurate click will turn the line red) you can modify it regarding | 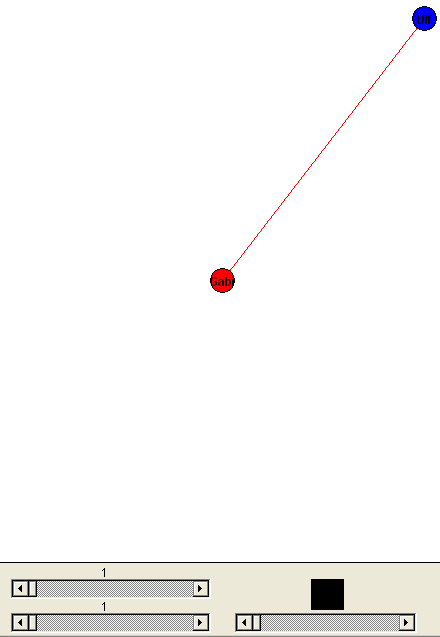 |
| thickness at start and endpoint, and color, by using the scrollbars below. You can rearrange the position of every circle without changing the relationship. | 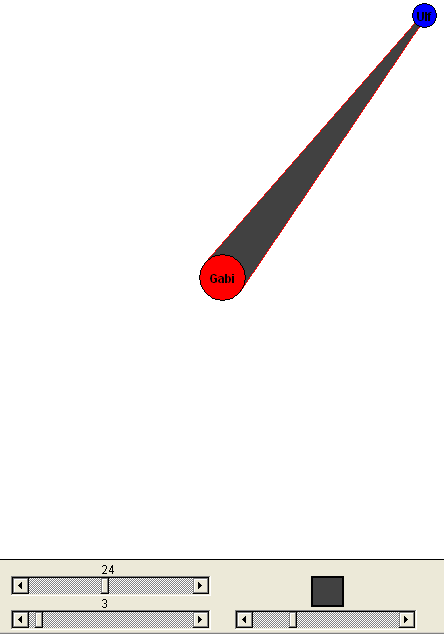 |
| When you have finished your sociogram you can save it as a text file by pressing the "Save"-button. You can load a previously saved sociogram with the "Load"-button. | 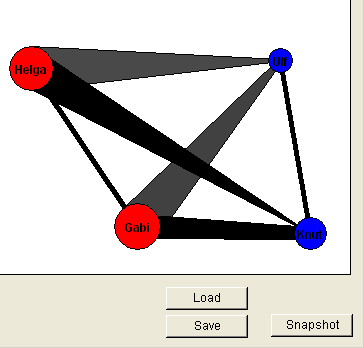 |
|
The saved text file contains all relevant information and can be read and edited using a standard texteditor software. This allows to manually change settings of the sociogram. For example the last three numbers (underlined in the example) represent the color of of the graphic Male1 labeled "M1". Color is coded as RGB (red, green, blue) values ranging from 0 to 255 each. In order to colorize M1 in orange fill in 255,125,0 instead.
|
Male1;241,414;90;0,0,255;M1 |
| To save the sociogram as a graphic file, press the "Snapshot"-button, enter a filename and then select the part of the image you want to export as a graphic file (file type: *.png). | 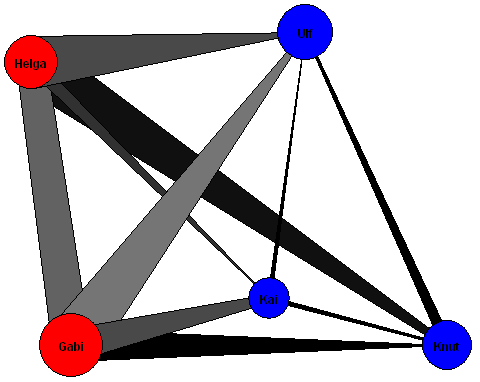 |